Introduction to Prometheus Toolkit in DevOps
Prometheus is an open-source system monitoring and alerting toolkit originally developed in SoundCloud. Now it is a standalone open-source project. Prometheus joins Cloud Native
Computing Foundation in 2016 as the second host project after Kubernetes.
Features of Prometheus Toolkit
- A multi-dimensional data model with time series data identified by metric name and key/value pairs
- PromQL, a flexible query language to take advantage of this dimension
- No reliance on distributed storage. Individual server nodes are autonomous
- Time series collection is done using a pull model over HTTP
- Time series push is supported through the intermediate gateway
- Targets are discovered via service discovery or static configuration
- Supports multiple graphs and dashboard modes
Components of Prometheus Toolkit
The Prometheus ecosystem consists of several components, many of which are optional:
- Prometheus main server to scrape and store time-series data
- Client library for instrumenting application code
- Push gateway to support short-lived jobs
- Special-purpose exporter for services such as HAProxy, StatsD, Graphite, and so on…
- Alertmanager for handling alerts
- Various support tools.
The architecture of Prometheus Toolkit
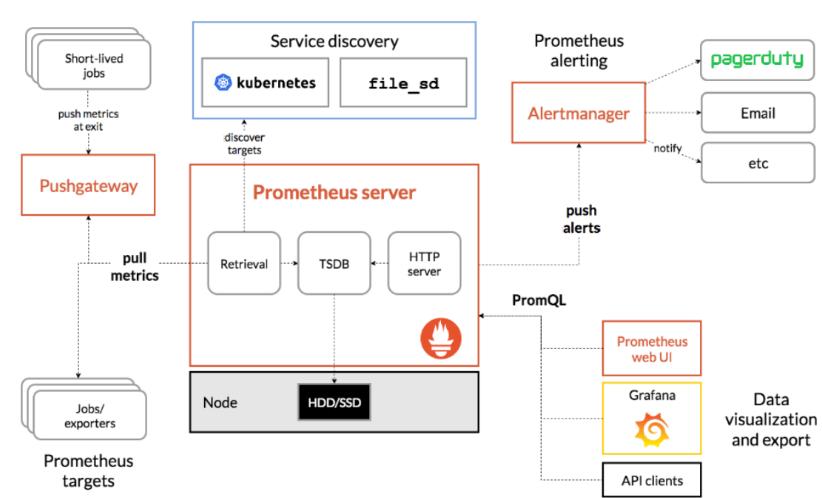
Prometheus scrapes metrics from instrumented jobs, either directly or via an intermediate push gateway for short-term work. Save all the samples you get locally and run rules against that data to aggregate and record new time series from existing data or generate alerts. You can use Grafana or other API consumers to visualize the collected data.
When does Prometheus Toolkit fit?
- Prometheus is suitable for recording purely numerical time series.
- Suitable for both machine-centric monitoring and highly dynamic service-oriented architecture monitoring.
- In the world of microservices, multidimensional data collection and queries are a particular strength.
- Prometheus is designed to provide reliability as a system to switch when stopped and you can quickly diagnose the problem.
- Each Prometheus server is self-contained and independent of network storage and more remote services.
- If the rest of your infrastructure fails and does not fail, you can trust it, and to use it, you need not set up a large infrastructure.
When does Prometheus Toolkit not fit?
- Prometheus values reliability.
- You can always view what statistics are available about your system, even under failure conditions.
- If you need 100% accuracy, such as for per-request billing, Prometheus is not a good choice as the collected data will likely not be detailed and complete enough. In such a case you would be best off using some other system to collect and analyze the data for billing, and Prometheus for the rest of your monitoring.
Prometheus Toolkit Installation
Prometheus is a monitoring platform that collects metrics from monitored targets through scraping metrics the HTTP endpoints for these targets.
Download and extract the latest version of Prometheus for your platform:
https://prometheus.io/download/
Download Prometheus:
curl -LO https://github.com/prometheus/prometheus/releases/download/v2.9.2/prometheus-
2.9.2.linux-amd64.tar.gz
Then use the sha256sum command to generate a checksum for the downloaded file.
$ sha256sum prometheus-2.9.2.linux-amd64.tar.gz
then extract tar file
$ tar xvf prometheus-2.9.2.linux-amd64.tar.gzThis will create a directory named Prometheus-2.9.2.linux-amd64 containing the two binaries. (Prometheus and promtool), consoles and console_libraries directories including the web Interface files, licenses, notifications, and some sample files.

Copy the two binaries to the /usr/local/bin directory.
$ sudo cp prometheus-2.9.2.linux-amd64/prometheus /usr/local/bin/
$ sudo cp prometheus-2.9.2.linux-amd64/promtool /usr/local/bin/
Configuring Prometheus Toolkit
Open the prometheus.yml file that contains enough information to run Prometheus for the first time.

The global settings define the default interval for scraping metrics. Beware of Prometheus will apply these settings to all exporters unless the individual exporter’s own settings override the global settings.
This scrape_interval value tells Prometheus to collect metrics from its exporters every 15
seconds, which is long enough for most exporters.
The evaluation_interval option controls how often Prometheus will evaluate rules. Prometheus
uses rules to create new time series and to generate alerts.
The rule_files block specifies the location of any rules we want the Prometheus server to load. For now, we’ve got no rules.
The final block, scrap_configs, controls the resources that Prometheus monitors. Since then Prometheus also exposes data about itself as an HTTP endpoint that can be evaluated and monitored its own health. In the default configuration, there is a single job called Prometheus that scrapes the time-series data provided by the Prometheus server. The job contains a single statically configured target, the localhost on port 9090. Prometheus expects metrics to be available on the target in the path of /metrics. Therefore, this default job scrapes through the URL.
http: // localhost: 9090 / metrics.
The time-series data returned shows the health and performance of the Prometheus server.
Starting Prometheus Toolkit
~/prometheus-2.9.2.linux-amd64# ./prometheus --config.file=prometheus.yml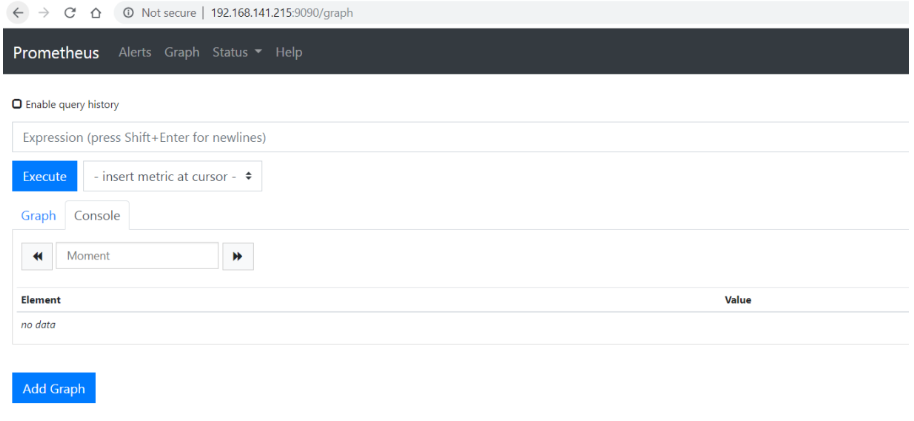
Prometheus should start. You also need to be able to go to the status page about itself http://localhost:9090. It takes about 30 seconds to collect data about itself from its HTTP metrics endpoint.
You can also go to Prometheus to see if Prometheus provides metrics about itself by navigating to its own metrics endpoint: http://localhost:9090/metrics.
Using the expression browser
As you can gather from http://localhost:9090/metrics, one metric that Prometheus exports
about itself is called promhttp_metric_handler_requests_total (the total number of /metrics
requests the Prometheus server has served). Go ahead and enter this into the expression
console
promhttp_metric_handler_requests_totalYou can use this query if you are only interested in requests with HTTP code 200. To get this information:
promhttp_metric_handler_requests_total{code="200"}
To count the number of returned time series, you could write:
count(promhttp_metric_handler_requests_total)
Using the graphing interface
To graph the formula, go to http://localhost:9090/graph and use the “Graph” tab.
For example, enter the following formula to graph the HTTP request rate per second and the self-scraped Prometheus returns status code 200.
rate(promhttp_metric_handler_requests_total{code="200"}[1m])
MONITORING LINUX HOST METRICS WITH THE NODE EXPORTER
Prometheus Node Exporter displays various related hardware and kernels metrics.
Note: Prometheus Node Exporter targets * nix systems, but WMI exporter for windows that serves a similar purpose.
Installing and running the Node Exporter
Prometheus Node Exporter is a single static binary that can be installed via a tarball.
https://prometheus.io/download/#node_exporter download using this link.
$ wget https://github.com/prometheus/node_exporter/releases/download/v0.17.0/node_exporter-
0.17.0.linux-amd64.tar.gz
then extract
$ tar xvzf node_exporter-0.17.0.linux-amd64.tar.gz
$ cd node_exporter-0.17.0.linux-amd64/
$ ./node_exporter &
The Node Exporter is running and you should see output similar to the following, indicating that it is displayed metrics for port 9100

Node Exporter metrics
After installing and running Node Exporter, you can verify that the metrics have been exported by cURLing the /metrics endpoint.
$ curl http://localhost:9100/metricsYou will the output like below

finished…! The node exporter has been successfully installed. Node exporter is now available Metrics that Prometheus can scrape, including the following various system metrics. Output (with node_ prefix). Here’s how to view these metrics (with help and type information).
$ curl http://localhost:9100/metrics | grep "node_"Configuring your Prometheus instances
Prometheus instances running locally must be properly configured for access Node export metrics. The following scrap_config block (in the prometheus.yml configuration file) tells the Prometheus instance to scrape from the node exporter over the local host: 9100

Go to the Prometheus installation directory, modify Prometheus.yml and run it
$ ./prometheus --config.file=./prometheus.yml &Exploring Node Exporter metrics through the Prometheus expression browser
Prometheus is scraping the metric from a running NodeExporter instance so you can do that Examine these metrics using the Prometheus UI (also known as Expression Browser). Invite create a graph with localhost: 9090 / in your browser and use the main expression bar at the top of the page to enter the expression. The expression bar looks like this

Metrics specific to the Node Exporter are prefixed with node_ and include metrics like
node_cpu_seconds_total and node_exporter_build_info.
- rate(node_cpu_seconds_total{mode=”system”}[1m]) -> The average amount of CPU time spent in system mode, per second, over the last minute (in seconds)
- node_filesystem_avail_bytes -> The filesystem space available to non-root users (in bytes)
- rate(node_network_receive_bytes_total[1m]) -> The average network traffic received, per second, over the last minute (in bytes)
- node_load15 -> load average in 15 seconds


If you want to configure multiple hosts, you can add prometheus.yml as below
scrape_configs:
# The job name is added as a label `job=<job_name>` to any timeseries scraped from this
config.
- job_name: 'node'
# metrics_path defaults to '/metrics'
# scheme defaults to 'http'.
static_configs:
- targets: ['192.168.x.x:9100']
- targets: ['192.168.x.y:9100']
- targets: ['192.168.x.z:9100']
GRAFANA
Grafana supports Prometheus queries. Includes Prometheus Grafana data source Grafana 2.5.0 (2015-10-28) or later.
Installing Grafana
Download and unzip Grafana from the binary tar.
$ wget https://dl.grafana.com/oss/release/grafana-6.1.6.linux-amd64.tar.gz
$ tar -zxvf grafana-6.1.6.linux-amd64.tar.gz
Start Grafana.
cd grafana-2.5.0/
./bin/grafana-server web
By default, Grafana will be listening on http://localhost:3000. The default login is “admin” /
“admin”.
Creating a Prometheus data source
To create a Prometheus data source:
- Click on the Grafana logo to open the sidebar menu.
- Then, Click on “Data Sources” in the sidebar.
- Click on “Add New”.
- Select “Prometheus” as the type.
- Set the appropriate Prometheus server URL (for example, http://localhost:9090/)
- Adjust other data source settings as desired (for example, turning the proxy access off).
- Click “Add” to save the new data source.
The following shows an example data source configuration:
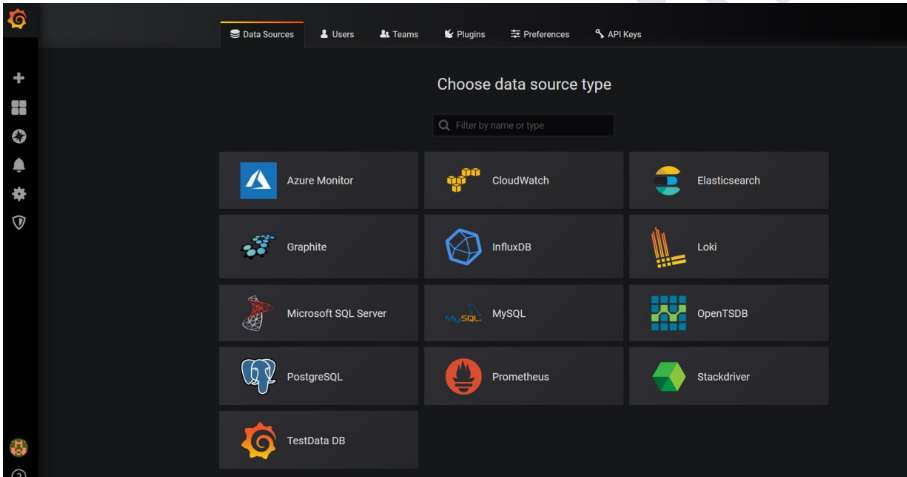
If you select Prometheus, the configuration page will be redirected. Add the required details Click Save and Test.

Creating a Prometheus graph
Follow the standard way to add a new Grafana graph. So:
- Go to panel bar click + mark create dashboard.
- Check on query.
- Enter a query in query panel.
- Under the “Metrics” tab, select your Prometheus data source (bottom right).
- To format the legend names of time series, use the “Legend format” input. For example,
to show only the method and status labels of a returned query result, separated by a
dash, you could use the legend format string {{method}} – {{status}}. - Tune other graph settings until you have a working graph.


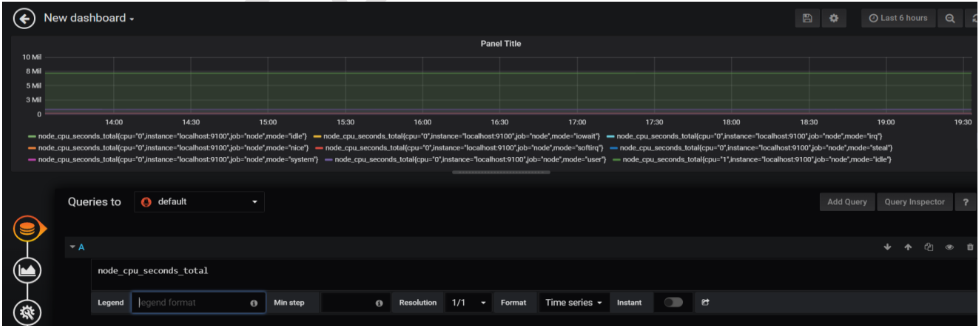
Then save the dash board
Now if you want node exporter dash boards into Grafana serach in google like “grafana node
e
If you want to search the node exporter dashboard in Grafana, search for “grafana node Exporter Metrics” in Google. You’ll see some default dashboards like the one below.
https://grafana.com/dashboards/405
https://grafana.com/dashboards/1860
https://grafana.com/dashboards/5174
https://grafana.com/dashboards/9096
If you want to add a node exporter dashboard to Grafana, go to the dashboard, click + mark, and click Import.

Then add the dashboard ID or URL and click Load.
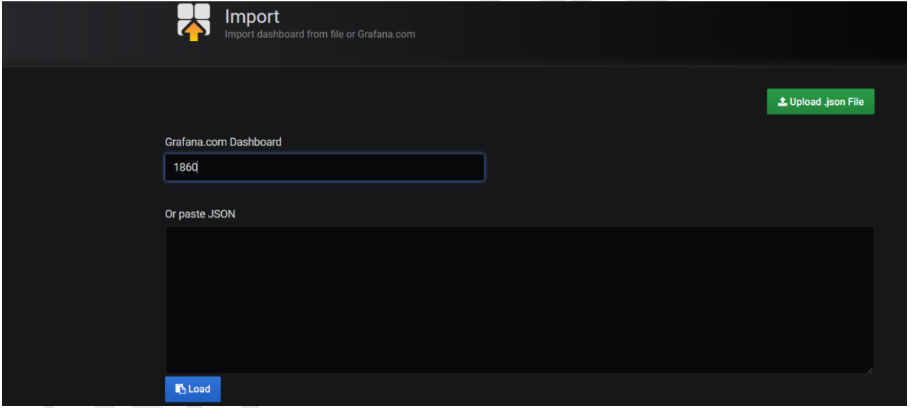
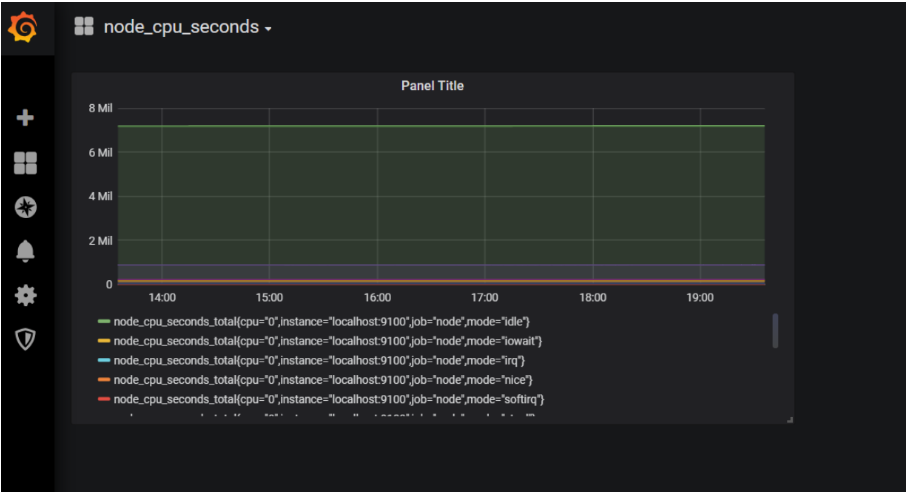
On the new page, select the Prometheus data source and click Import.

And see the dash board like below…
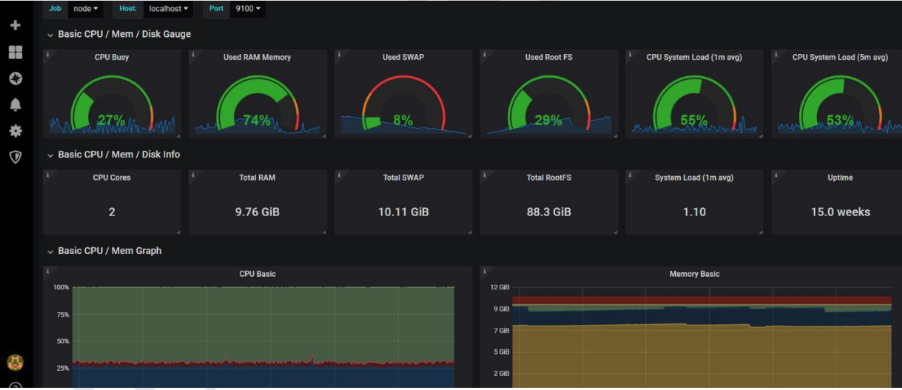
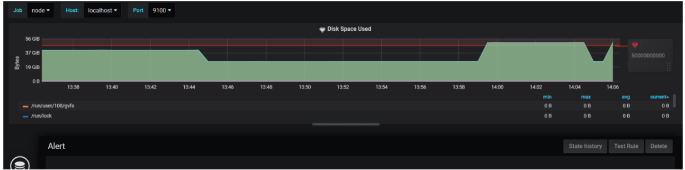
If you need to troubleshoot, add a large file and check the graph …
Run this command on your system. A 10GB file will be created …
fallocate -l 10G gentoo_root.imgSelect the graph for the last 5 minutes, go to the Disk Capacity section and see your changes in the Disk Capacity graph.
This basic net / disk information section.

Alerting
When an alert changes state it sends out notifications. Each alert rule can have multiple
notifications. But in order to add a notification to an alert rule you first need to add and
configure a notification channel (can be email, Pagerduty or other integration). This is done
from the Notification Channels page.
Supported Notification Types.
- Slack
- PagerDuty
- Webhook
Other Supported Notification Channels
Grafana also supports the following notification channels:
HipChat
VictorOps
Sensu
OpsGenie
Threema
Pushover
Telegram
LINE
DingDing
Notification Channel Setup
On the Alarm Notification Channel page, click the New Channel button to go to the next page.
You can configure and setup new notification channels.

If you select email as the alert type, you need to configure the SMTP server details inside Grafana/conf folder.
Go to “conf” directory of your Grafana distribution
Open the configuration file as you did the setup by default. Therefore, use “defaults.ini”. Go to SMTP / Email Settings and update your SMTP details. There is fake SMTP the server runs on localhost and port 25. The structure of my “defaults.ini” is as follows:
#################################### SMTP / Emailing #####################
[smtp]
enabled = true
host = localhost:25
user =
# If the password contains # or ; you have to wrap it with triple quotes. Ex
"""#password;"""
password =
cert_file =
key_file =
skip_verify = false
from_address = admin@grafana.localhost
from_name = Grafana
ehlo_identity =
Add SMTP validation such as username and password host configuration. After confirmation
When you’re done, you’ll need to restart your Grafana server.
If you’re using Gmail as your SMTP server, use the following configuration

$ ./bin/Grafana-server webFinally, now ready to configure email alert type.

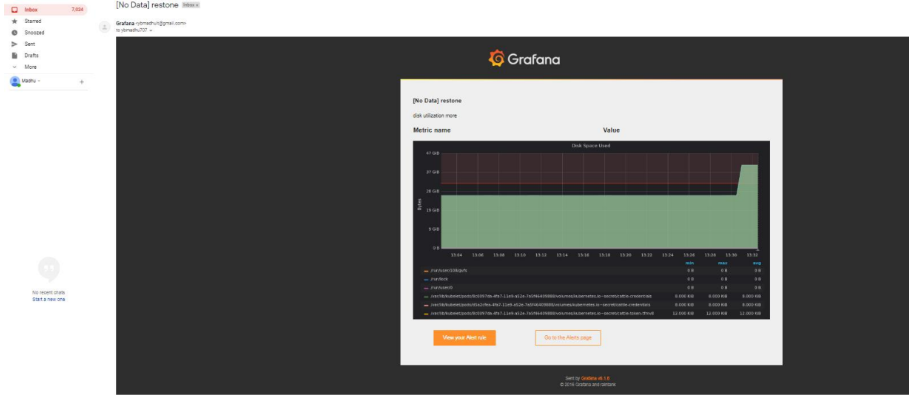
Enter the appropriate values in the Alert Name and Alert Type fields and add your email address
Numbers separated by ';' …. etc. Finally, click the Submit Test button and confirm the following:
Whether you received the email.
Enable images in notifications
Grafana can render the panel associated with the alert rule and include it in the notification. Most notification channels require this image to be published (Slack and PagerDuty for example). To include the image in the alert, Grafana can upload the image to the image store. It currently supports Amazon S3 and Webdav. So to set it you need to configure the external image uploader in the Grafana-server ini configuration file.
Currently, if no external image storage is specified, only the email channel will attach the image. If you want to include images in alerts for other channels, you need to set up an external Image storage channel.
And now test email alert with real example….
Goto dashboard panel and select a graph which we no need add alert.
And go and edit

Clicking Edit will redirect you to the Configuration tab as shown below.
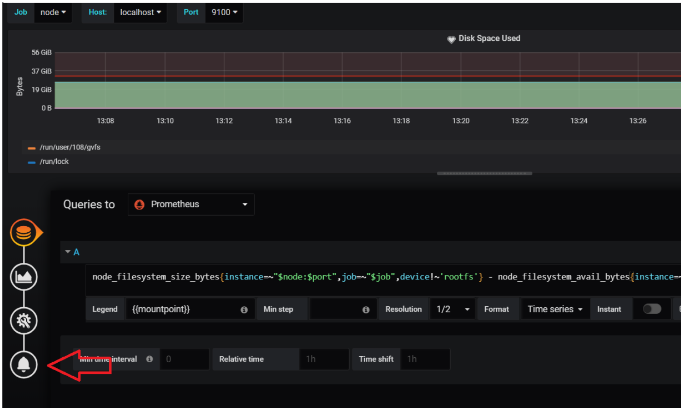
Click the bell icon to add an alert setting. Then the Configuration tab is displayed as follows:
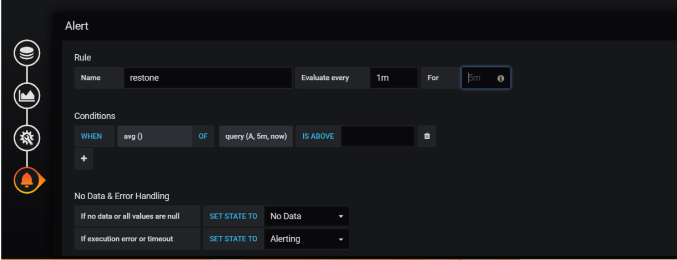
Now we need to the rule name and evaluate every ( minutes of time ) for when we need to
send mail in for section (for example sec or min –15s or 30s or 1m )
And need to add condition of threshold value here…
Name: Give a suitable name to this alert.
Evaluate every time: The time interval to evaluate this rule. “H” means hours, “m” means minutes and “s” means seconds.
I use 5s (5 seconds). Production environments should set this to a higher value.
In the Conditions section, click the function name to change it to the function you want. We are using “Avg()” to validate the rule against average disk usage.
In function “query (A, 5m, now)”.
The first argument (A) is the query id to be used form all the queries which we have configured
in “Metrics” tab. As we have the usage average query in section “A”.
Second and third arguments define the time range. Our query means 5 minutes come back from now.
You can validate the rule by clicking Test Rule. The rule displays an error if it contains one. My final setup is as follows:
And write meaning full message in the message box and add the appropriate channel to send alert notification.
To warn you of specific thresholds for disk usage, configure as follows:

Save when the configuration is complete.
In this example, use the following command to create a large file on the file system.
$ fallocate -l 25G gentoo_root.imgFinally, You have now configured 50% of your disk usage. Beyond that, a warning will be displayed as graphical notification.