Course Overview

































Course Content
Introduction to Statistical Analysis
- Introduction to Probability (Copy)
- Probability Addition Rule (Copy)
- Probability Multiplication Rule (Copy)
- Distributions (Copy)
- Correlation (Copy)
- Regression (Copy)
- Hypothesis Testing (Copy)
- ANOVA and Chi-Square Tests (Copy)
- Data Cleaning (Copy)
- Imputation Techniques (Copy)
- Measure Of central tendency, Measures of Dispersion (Copy)
- Graphical Techniques, Skewness & Kurtosis, Box Plot (Copy)
- Descriptive Stats (Copy)
- Central Limit Theorem, Confidence interval (Copy)
- Hands-On (Copy)
Introduction to Data Analytics
- Data Analytics Overview (Copy)
- Importance of Data Analytics (Copy)
- Types of Data Analytics (Copy)
- Descriptive Analytics (Copy)
- Diagnostic Analytics (Copy)
- Predictive Analytics (Copy)
- Prescriptive Analytics (Copy)
- Benefits of Data Analytics (Copy)
- Data Visualization for Decision Making (Copy)
- Hands-On (Copy)
Excel: Basics to Advanced
- Excel tutorial (Copy)
- Text to Columns (Copy)
- Concatenate (Copy)
- The Concatenate Function (Copy)
- The Right Function with Concatenation (Copy)
- Absolute Cell References (Copy)
- Data Validation (Copy)
- Time and Date Calculations (Copy)
- Conditional Formatting (Copy)
- Exploring Styles and Clearing Formatting (Copy)
- Using Conditional Formatting to Hide Cells (Copy)
- Using the IF Function (Copy)
- Changing the “Value if false” Condition to Text (Copy)
- Pivot Tables (Copy)
- Creating a Pivot Table (Copy)
- Specifying PivotTable Data (Copy)
- Changing a PivotTables Calculation (Copy)
- Filtering and Sorting a PivotTable (Copy)
- Creating a PivotChart (Copy)
- Grouping Items (Copy)
- Updating a PivotTable (Copy)
- Formatting a PivotTable (Copy)
- Using Slicers (Copy)
- Charts (Copy)
- Creating a Simple Chart (Copy)
- Charting Non-Adjacent Cells (Copy)
- Creating a Chart Using the Chart Wizard (Copy)
- Modifying Charts (Copy)
- Moving an Embedded Chart (Copy)
- Sizing an Embedded Chart (Copy)
- Changing the Chart Type (Copy)
- Chart Types (Copy)
- Changing the Way Data is Displayed (Copy)
- Moving the Legend (Copy)
- Formatting Charts (Copy)
- Adding Chart Items (Copy)
- Formatting All Text (Copy)
- Formatting and Aligning Numbers (Copy)
- Formatting the Plot Area (Copy)
- Formatting Data Markers (Copy)
- Pie Charts (Copy)
- Creating a Pie Chart (Copy)
- Moving the Pie Chart to its Own Sheet (Copy)
- Adding Data Labels (Copy)
- Exploding a Slice of a Pie Chart (Copy)
- Data Analysis − Overview (Copy)
- types of Data Analysis (Copy)
- Data Analysis Process (Copy)
- Working with Range Names (Copy)
- Copying Name using Formula Autocomplete (Copy)
- Range Name Syntax Rules (Copy)
- Creating Range Names (Copy)
- Creating Names for Constants (Copy)
- Managing Names (Copy)
- Scope of a Name (Copy)
- Editing Names (Copy)
- Applying Names (Copy)
- Using Names in a Formula (Copy)
- Viewing Names in a Workbook (Copy)
- Copying Formulas with Names (Copy)
- Difference between Tables and Ranges (Copy)
- Create Table (Copy)
- Table Name (Copy)
- Managing Names in a Table (Copy)
- Table Headers replacing Column Letters (Copy)
- Propagation of a Formula in a Table (Copy)
- Resize Table (Copy)
- Remove Duplicates (Copy)
- Convert to Range (Copy)
- Table Style Options (Copy)
- Table Styles (Copy)
- Cleaning Data with Text Functions (Copy)
- Removing Unwanted Characters from Text (Copy)
- Extracting Data Values from Text (Copy)
- Formatting Data with Text Functions (Copy)
- Date Formats (Copy)
- Conditional Formatting (Copy)
- Sorting (Copy)
- Filtering (Copy)
- Lookup Functions (Copy)
- Pivoting (Copy)
- Hands-On (Copy)
SQL
- Fundamentals of SQL Syntax and Statements (Copy)
- Data Filtering and Sorting Techniques (Copy)
- Utilization of Single-Row Functions (Copy)
- Aggregate and Group Functions (Copy)
- Analytical (Window) Functions (Copy)
- Data Definition Language (DDL) – Creating and Managing Schema Objects (Copy)
- Data Manipulation Language (DML) – Inserting, Updating, and Deleting Data (Copy)
- Implementation of Data Constraints (Copy)
- Set Operations – UNION, INTERSECT, and MINUS (Copy)
- Subqueries and Nested Queries (Copy)
- Joins and Multi-Table Queries (Copy)
- Transaction Control Language (TCL) – COMMIT, ROLLBACK, SAVEPOINT (Copy)
- Data Control Language (DCL) – GRANT and REVOKE Permissions (Copy)
- Hands-On (Copy)
Learn Tableau Charts
- Area Chart (Copy)
- Bar Chart (Copy)
- Box Plot (Copy)
- Bubble Chart (Copy)
- Bump Chart (Copy)
- Bullet Graph (Copy)
- Circle Views (Copy)
- Dual Combination Chart (Copy)
- Dual Lines Chart (Copy)
- Funnel Chart (Copy)
- Traditional Funnel Charts (Copy)
- Gantt Chart (Copy)
- Grouped Bar or Side by Side Bars Chart (Copy)
- Heatmap (Copy)
- Highlight Table (Copy)
- Histogram (Copy)
- Cumulative Histogram (Copy)
- Line Chart (Copy)
- Lollipop Chart (Copy)
- Pareto Chart (Copy)
- Pie Chart (Copy)
- Scatter Plot (Copy)
- Stacked Bar Chart (Copy)
- Text Label (Copy)
- Tree Map (Copy)
- Word Cloud (Copy)
- Waterfall Chart (Copy)
- Hands-On (Copy)
Learn Tableau Advanced Reports
- Dual Axis Reports (Copy)
- Blended Axis (Copy)
- Individual Axis (Copy)
- Add Reference Lines (Copy)
- Reference Bands (Copy)
- Reference Distributions (Copy)
- Basic Maps (Copy)
- Symbol Map (Copy)
- Use Google Maps (Copy)
- Mapbox Maps as a Background Map (Copy)
- WMS Server Map as a Background Map (Copy)
- Hands-On (Copy)
Learn Tableau Calculations & Filters
- Calculated Fields (Copy)
- Basic Approach to Calculate Rank (Copy)
- Advanced Approach to Calculate Ra (Copy)
- Calculating Running Total (Copy)
- Filters Introduction (Copy)
- Quick Filters (Copy)
- Filters on Dimensions (Copy)
- Conditional Filters (Copy)
- Top and Bottom Filters (Copy)
- Filters on Measures (Copy)
- Context Filters (Copy)
- Slicing Filters (Copy)
- Data Source Filters (Copy)
- Extract Filters (Copy)
- Hands-On (Copy)
Introduction to Power BI
- Get Started with Power BI (Copy)
- Overview: Power BI concepts (Copy)
- Sign up for Power BI (Copy)
- Overview: Power BI data sources (Copy)
- Connect to a SaaS solution (Copy)
- Upload a local CSV file (Copy)
- Connect to Excel data that can be refreshed (Copy)
- Connect to a sample (Copy)
- Create a Report with Visualizations (Copy)
- Explore the Power BI portal (Copy)
- Hands-On (Copy)
Viz and Tiles
- Overview: Visualizations (Copy)
- Using visualizations (Copy)
- Create a new report (Copy)
- Create and arrange visualizations (Copy)
- Format a visualization (Copy)
- Create chart visualizations (Copy)
- Use text, map, and gauge visualizations and save a report (Copy)
- Use a slicer to filter visualizations (Copy)
- Sort, copy, and paste visualizations (Copy)
- Download and use a custom visual from the gallery (Copy)
- Hands-On (Copy)
Reports and Dashboards
- Modify and Print a Report (Copy)
- Rename and delete report pages (Copy)
- Add a filter to a page or report (Copy)
- Set visualization interactions (Copy)
- Print a report page (Copy)
- Send a report to PowerPoint (Copy)
- Create a Dashboard (Copy)
- Create and manage dashboards (Copy)
- Pin a report tile to a dashboard (Copy)
- Pin a live report page to a dashboard (Copy)
- Pin a tile from another dashboard (Copy)
- Pin an Excel element to a dashboard (Copy)
- Manage pinned elements in Excel (Copy)
- Add a tile to a dashboard (Copy)
- Build a dashboard with Quick Insights (Copy)
- Set a Featured (default) dashboard (Copy)
- Ask Questions about Your Data (Copy)
- Ask a question with Power BI Q&A (Copy)
- Tweak your dataset for Q&A (Copy)
- Enable Cortana for Power BI (Copy)
- Hands-On (Copy)
Publishing Workbooks and Workspace
- Share Data with Colleagues and Others (Copy)
- Publish a report to the web (Copy)
- Manage published reports (Copy)
- Share a dashboard (Copy)
- Create an app workspace and add users (Copy)
- Publish an app (Copy)
- Use an app workspace (Copy)
- Create a QR code to share a tile (Copy)
- Embed a report in SharePoint Online (Copy)
- Hands-On (Copy)
Other Power BI Components and Table Relationship
- Use Power BI Mobile Apps (Copy)
- Get Power BI for mobile (Copy)
- View reports and dashboards in the iPad app (Copy)
- Use workspaces in the mobile app (Copy)
- Use Power BI Desktop (Copy)
- Sharing from Power BI Mobile (Copy)
- Install and launch Power BI Desktop (Copy)
- Get data (Copy)
- Reduce data (Copy)
- Transform data (Copy)
- Relate tables (Copy)
- Get Power BI Desktop data with the Power BI service (Copy)
- Export a report from Power BI service to Desktop (Copy)
- Hands-On (Copy)
Python Basics
- Python Installation and Environment Setup (Copy)
- Python Syntax and Code Structure (Copy)
- Variables and Data Types (Copy)
- Operators and Expressions (Copy)
- Conditional Statements (if, else, elif) (Copy)
- Looping Constructs (for, while) (Copy)
- Data Handling & Analysis in Python (For Data Analysts) (Copy)
- Introduction to NumPy for Numerical Operations (Copy)
- Data Manipulation with Pandas (Copy)
- Series and DataFramesData Selection and Filtering (Copy)
- Handling Missing DataData Aggregation and Grouping (Copy)
- Merging, Joining, and Concatenating DataFrames (Copy)
- Reading and Writing Data Files (Copy)
- CSV, Excel (Copy)
- Data Cleaning Techniques (Copy)
- Duplicates, Outliers (Copy)
- Exploratory Data Analysis (EDA) with Pandas (Copy)
- Data Visualization Basics (Copy)
- Using Matplotlib and Seaborn (Copy)
- Hands-On (Copy)
FAQs
eMexo Technologies technology provides DevOps Master Program training by experienced trainers with over 10 years of experience.
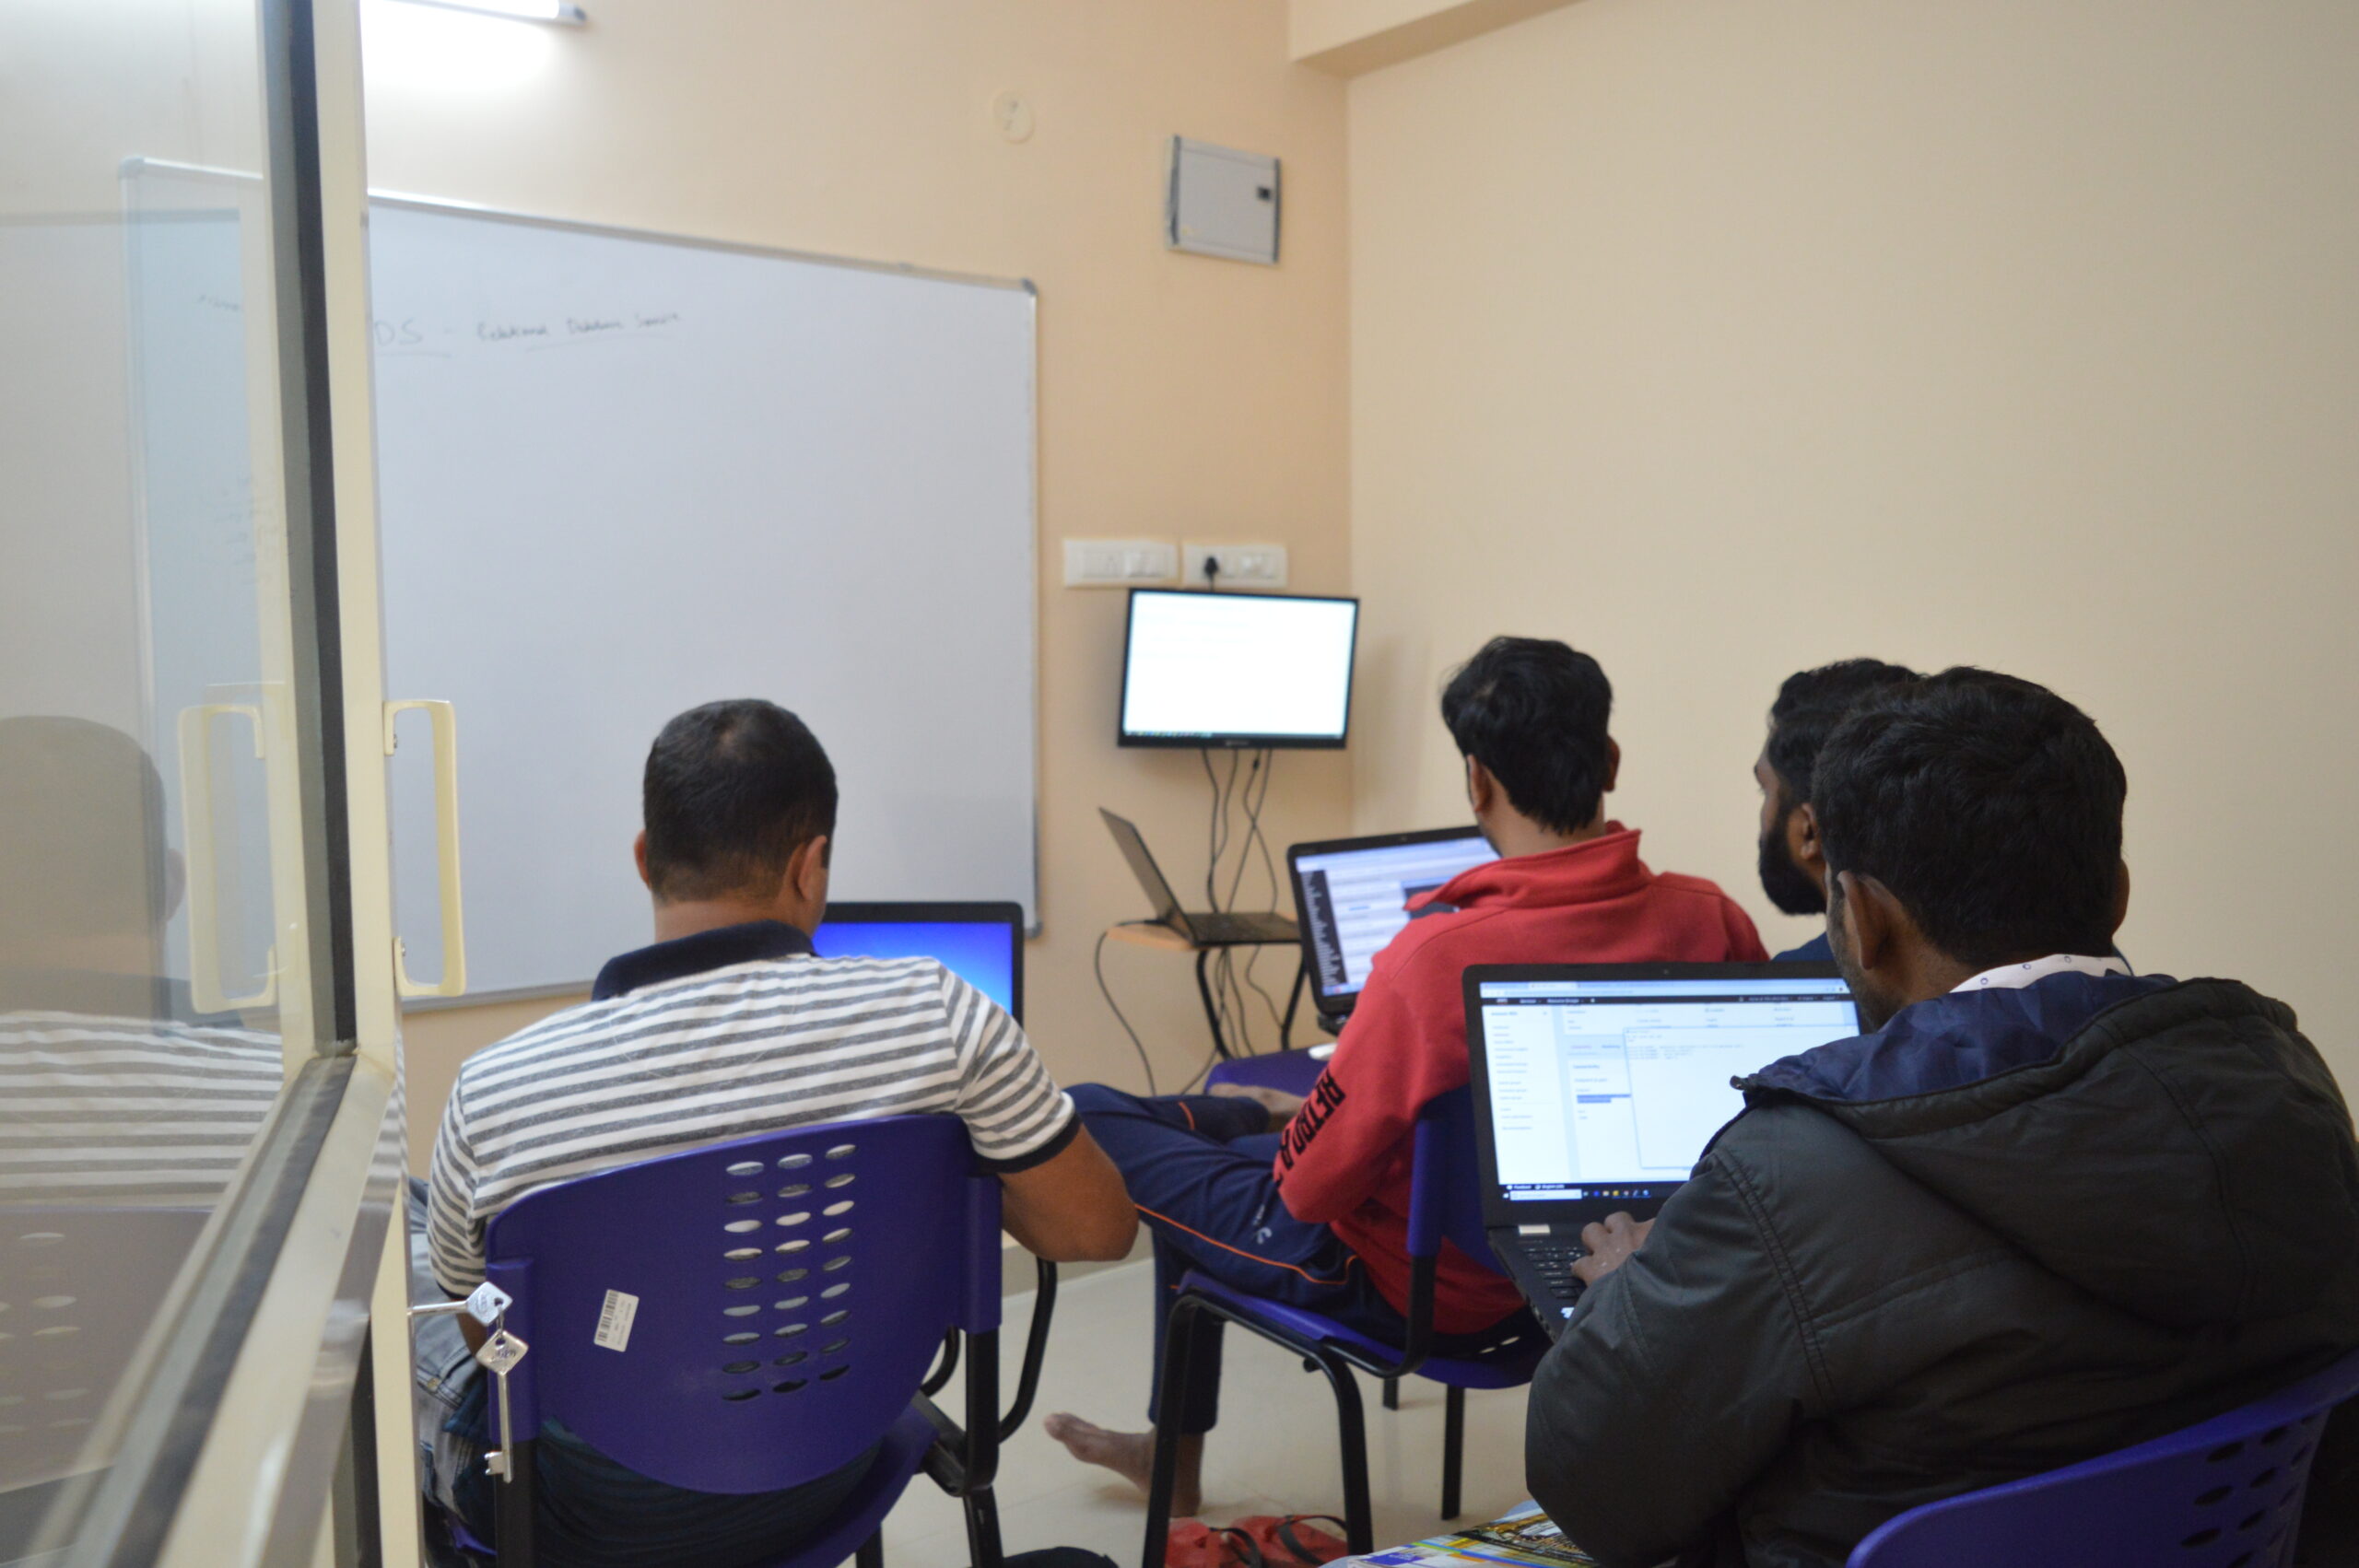
We provide complete hands-on training.
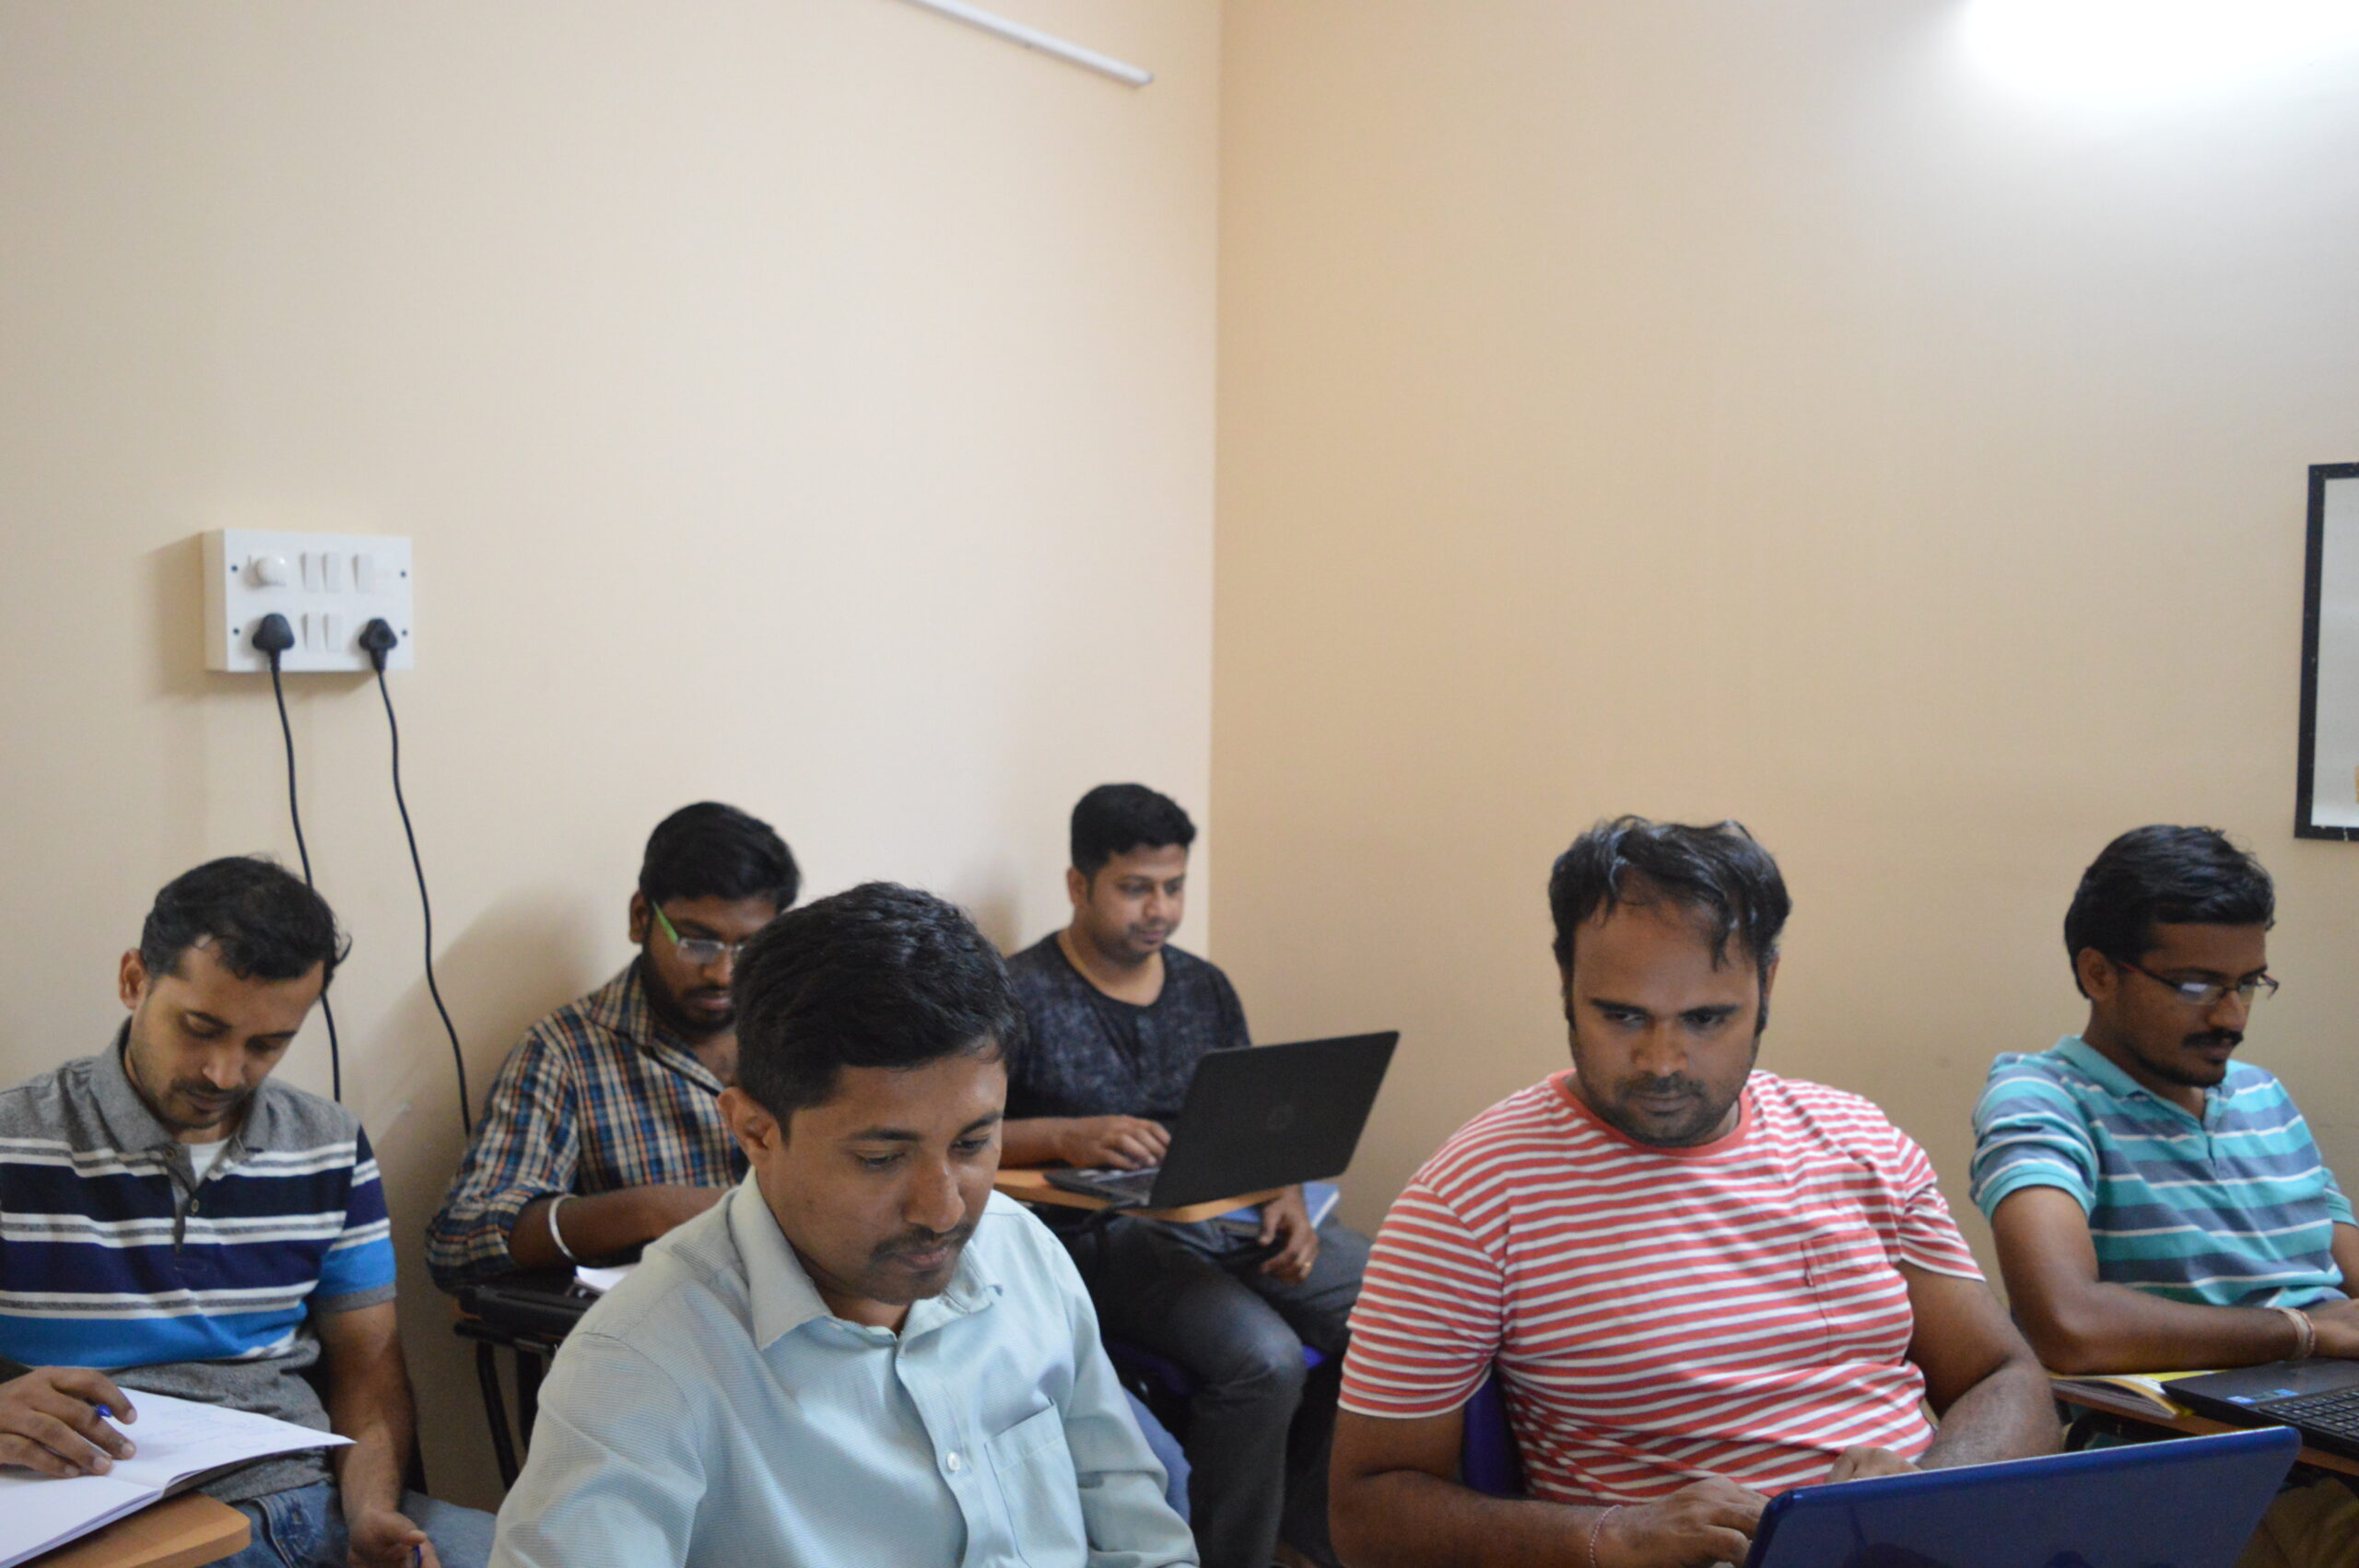
Over 500 batches completed their training in our Institute.
And also we provide100% Job-Oriented training.
We guide students in their Certification exams and building their resume.
Unique course materials were used for training.
We help them to prepare for their job interview.
Over 2000 happy students get trained on this affordable pricing.
No problem. eMexo Technologies will reschedule the missed classes within the course period. If required you can attend those topics with any other batches.
All of our instructors are industry experts hired by top companies and have hands-on experience with DevOps Master Program.
At eMexo, we believe that there is nothing better than hands-on practice when it comes to learning concepts. our teaching method is 100% practical. You learn a concept, you practice it then and there with the trainer. It also provides assignments for each topic that you can practice at home so that questions about the topic can be clarified to the trainer the next day.
DevOps-certified professionals who are working in a real-time environment are designated as DevOps Engineers. The main area of focus for DevOps engineers is to maintain a seamless communication between the development and operational side of an organization. They follow the principles of continuous development, continuous testing, continuous integration, continuous deployment, and continuous monitoring to make sure that the product gains maximum profitability.
Our trainers are expert professionals in their organizations and they often act as the interviewer to hire new candidates. Our trainers will help you prepare your resume with industry standards. After all, they know exactly what to look for in a resume.
Our trainers are professionals working in multinational corporations. They are experts in their field and they know exactly what the interviewer will look for in the candidate. Experienced trainers not only share interview questions but also conduct mock interviews to help prepare for the actual interview.
DevOps methodology is based on the principles of continuous deployment, integration, and monitoring. It emphasizes the need for continuous changes and upgrades that drive the production and maintenance of a software application. The process starts with planning and coding, and then the application is built and tested. The application is then released and deployed by the Ops team, who is also responsible for monitoring the application.
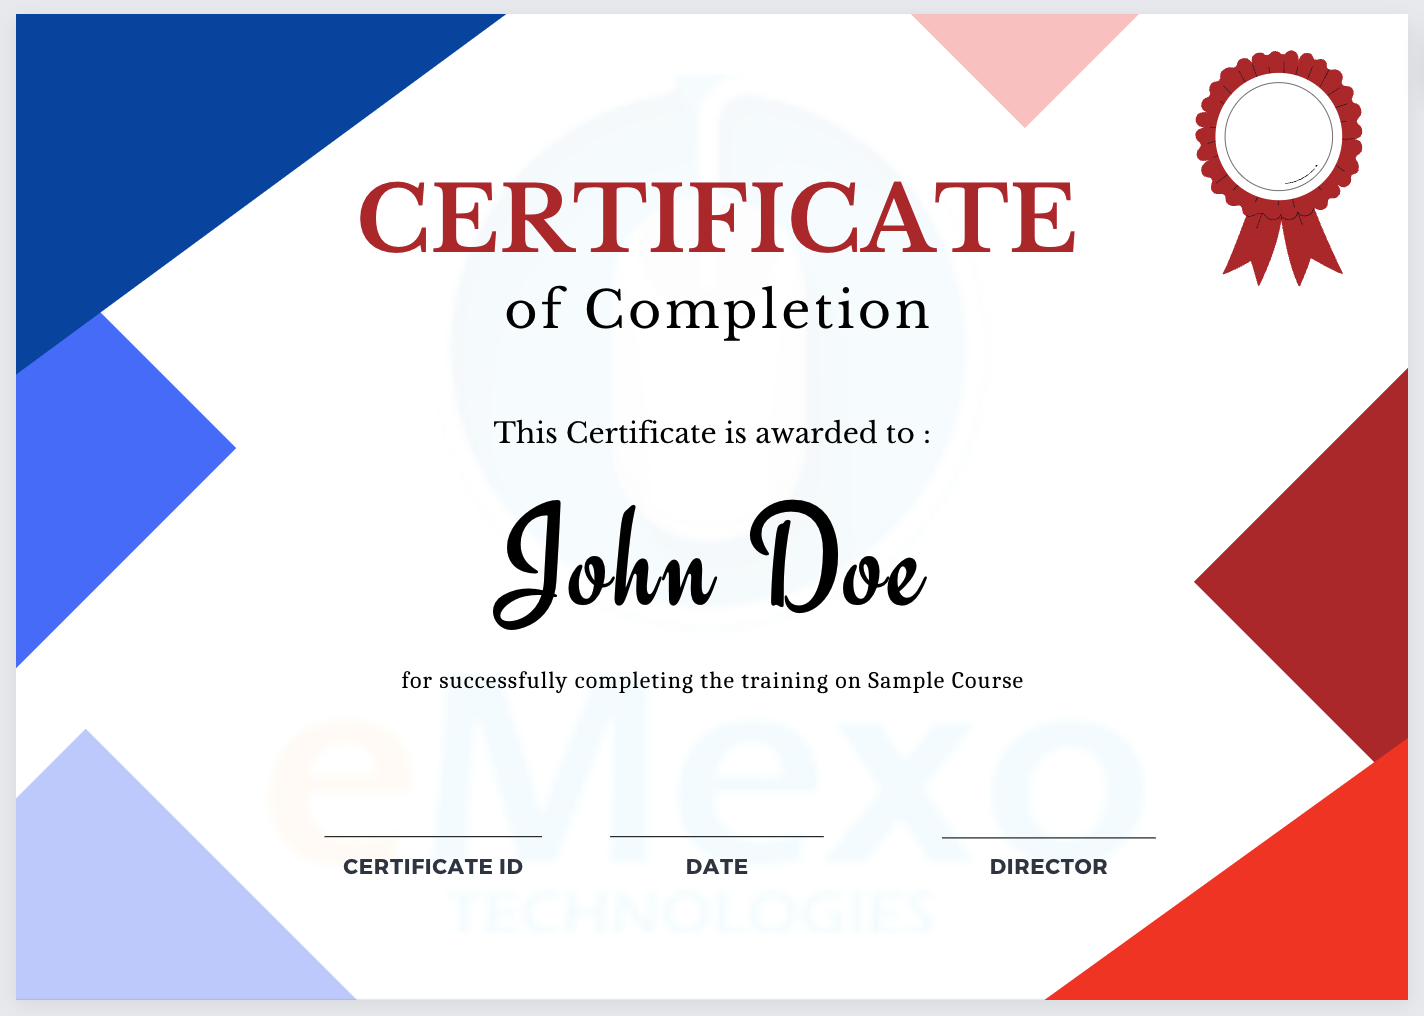
Yes, at the end of training we provide a certification of completion.
Yes, we also provide fast-track training for those who want to complete the course faster. The curriculum and the total hours required to complete the course will remain the same. However, the trainer will be spending more hours with you to complete the course.
We provide both regular and weekend training. Talk to our training partner to learn more about the timings.
Yes, apart from doing the hands-on practice our trainer will also be taking a real-world project and working with you for the implementation.
Yes, absolutely! Talk to our training counselor by phone at +91-9513216462 or email us at info@emexotechnologies.com to arrange a free demo. You can also fill in the contact us form below and we will call you to discuss your training requirements.
Yes, once enrolled in a course, you will have lifetime access to course materials.
Please contact our course advisor at +91-9513216462 or you can share your queries through info@emexotechnologies.com