Course Overview
Course Content
Module 2: Introduction to Python for Data Science
- Why Python for Data Science?
- Advantages over other languages (R, Java, etc.)
- Industry use cases
- Python Setup & Environment
- Installing Python (Anaconda, Miniconda)
- Using Jupyter Notebook, Google Colab
- Python interpreters & IDEs (PyCharm, VS Code, Spyder)
- Python Fundamentals
- Python syntax, indentation, and comments
- Variables and data types (int, float, string, boolean)
- Type casting (implicit & explicit)
- Operators
- Arithmetic, comparison, logical, assignment, membership, identity
- Input & output functions
- Hands-on Exercises:
- Creating a basic Python program to take input and display output
- Simple calculator using Python
- Data Structures in Python
- Lists – creation, indexing, slicing, adding/removing elements, list comprehensions
- Tuples – immutability, tuple unpacking
- Sets – uniqueness, set operations (union, intersection, difference)
- Dictionaries – key-value pairs, CRUD operations, looping
- Nested data structures
- Hands-on Exercises:
- Store and retrieve student data using dictionaries
- Unique word extraction from a paragraph
- Control Flow
- Conditional statements – if, elif, else
- Loops – for, while
- Hands-on Exercises:
- Prime number checker
- Pattern printing
- Functions & Modules
- Defining and calling functions
- Function arguments (positional, keyword, default, variable-length)
- Return values
- Lambda functions
- Modules and Packages
- Importing built-in modules (math, datetime, random, os)
- Creating custom modules
- Hands-on Exercises:
- Build a reusable data-cleaning function
- File Handling
- Opening and reading files
- Writing and appending files
- Working with CSV & JSON files
- Hands-on Exercises:
- Read a CSV file and process the data
- Convert JSON data to CSV
- Python Libraries for Data Science
- NumPy – Numerical Computing
- Creating arrays
- Array indexing and slicing
- Array operations
- Mathematical and statistical functions
- Reshaping and stacking arrays
- Broadcasting
- Pandas – Data Manipulation
- Series and DataFrames
- Importing datasets (CSV, Excel, SQL)
- Data selection (loc, iloc)
- Handling missing values
- Data filtering and sorting
- Grouping and aggregation
- Merging and joining DataFrames
- Matplotlib & Seaborn – Data Visualization
- Basic plots (line, bar, scatter, histogram)
- Customizing plots (labels, titles, legends)
- Seaborn visualizations (boxplot, heatmap, pairplot, violin plot)
- Style customization and color palettes
- Data Cleaning & Preprocessing in Python
- Detecting and handling missing data
- Outlier detection and treatment
- Encoding categorical variables
- Feature scaling (normalization, standardization)
- String operations for text cleaning
- Hands-on Exercises:
- Clean and preprocess a dataset for analysis
- Working with APIs & Web Data
- Introduction to APIs
- Using Python’s requests library
- Fetching JSON data from APIs
- Parsing and storing API data
- Hands-on Exercises:
- Fetch live weather data from an API
- Introduction to Statistical Analysis in Python
- Descriptive statistics with Pandas & NumPy
- Correlation & covariance
- Probability distributions (Normal, Binomial)
- Hypothesis testing basics
- Hands-on Exercises:
- Perform statistical summary of a dataset
Module 3: Statistics & Probability for Data Science
- Introduction to Statistics for Data Science
- What is Statistics?
- Descriptive vs. Inferential Statistics
- Role of statistics in data science & analytics
- Importance of statistics in decision-making
- Types of data:
- Quantitative vs. Qualitative
- Discrete vs. Continuous
- Nominal, Ordinal, Interval, Ratio scales
- Hands-on: Identify data types from sample datasets
- Descriptive Statistics
- Measures of Central Tendency
- Mean, Median, Mode
- Weighted average
- Measures of Dispersion
- Shape of Data Distribution
- Skewness (positive, negative, zero)
- Kurtosis (leptokurtic, platykurtic, mesokurtic)
- Hands-on: Use Python (Pandas, NumPy) to calculate statistical measures
- Data Visualization for Statistics
- Histograms, Bar Charts, Box Plots
- Scatter Plots for correlation visualization
- Probability distribution plots
- Hands-on: Visualize sales data distribution using Matplotlib/Seaborn
- Probability Fundamentals
- Basic probability concepts
- Sample space, events, outcomes
- Types of probability:
- Theoretical, Experimental, Axiomatic
- Addition & Multiplication rules of probability
- Conditional probability & Independence
- Bayes’ Theorem – theory and real-life applications
- Hands-on: Solve probability problems using Python
- Probability Distributions
- Discrete Distributions
- Bernoulli Distribution
- Binomial Distribution
- Poisson Distribution
- Continuous Distributions
- Uniform Distribution
- Normal (Gaussian) Distribution
- Normal (Gaussian) Distribution
- Empirical rule (68-95-99.7)
- Exponential Distribution
- Hands-on: Plot and simulate different distributions in Python
- Sampling & Sampling Distributions
- Population vs. Sample
- Sampling techniques:
- Random sampling, Stratified sampling, Cluster sampling, Systematic sampling
- Central Limit Theorem & its importance in Data Science
- Sampling distribution of the sample mean
- Hands-on: Simulate Central Limit Theorem using Python
- Inferential Statistics
- Concept of estimation – point & interval estimates
- Confidence intervals (for mean & proportion)
- Margin of error
- Hands-on: Calculate confidence intervals for a dataset
- Hypothesis Testing
- Null Hypothesis (H₀) & Alternative Hypothesis (H₁)
- Type I and Type II errors
- P-value and significance levels (α)
- One-tailed & two-tailed tests
- Common Statistical Tests:
- Z-tes
- T-test (one-sample, independent, paired)
- Chi-Square test
- ANOVA (One-way & Two-way)
- Hands-on: Perform hypothesis testing on sample datasets
- Correlation & Regression Basics
- Covariance & Correlation
- Introduction to Linear Regression
- Interpreting correlation coefficients
- Hands-on: Calculate correlation between features in a dataset
- Real-World Data Science Applications
Module 6: SQL for Data Science
- Introduction to SQL & Databases
- What is SQL? Why SQL for Data Science?
- Understanding databases – relational vs. non-relational
- Tables, rows, columns, and relationships
- Primary keys & foreign keys
- Installing & setting up SQL environment (MySQL, PostgreSQL, SQLite)
- Connecting Python to SQL for data analysis
- Hands-on: Create a database and a simple table
- Basic SQL Queries
- SELECT statement
- DISTINCT keyword
- WHERE clause – filtering records
- Logical operators (AND, OR, NOT)
- Comparison operators (=, !=, <, >, <=, >=)
- BETWEEN, IN, LIKE (wildcards % and _)
- ORDER BY – sorting results
- LIMIT – restricting output
- Hands-on: Retrieve filtered and sorted data from a dataset
- SQL Functions for Data Analysis
- Aggregate Functions – COUNT(), SUM(), AVG(), MIN(), MAX()
- String Functions – UPPER(), LOWER(), CONCAT(), TRIM(), SUBSTRING()
- Date & Time Functions – NOW(), DATE(), YEAR(), MONTH(), DATEDIFF()
- Mathematical Functions – ROUND(), ABS(), CEIL(), FLOOR()
- Hands-on: Generate sales reports using aggregate functions
- Grouping & Aggregation
- GROUP BY – grouping data for analysis
- HAVING – filtering aggregated data
- Nested aggregation
- Hands-on: Find top-performing products by category
- Joins & Relationships
- INNER JOIN – matching rows between tables
- LEFT JOIN, RIGHT JOIN, FULL OUTER JOIN
- Self-joins
- Cross joins
- Joining more than two tables
- Hands-on: Merge customer and sales data for combined analysis
- Subqueries & Derived Tables
- Subqueries in SELECT, FROM, WHERE clauses
- Correlated subqueries
- Derived tables (inline views)
- Hands-on: Find customers who purchased above the average order value
- Set Operations
- UNION and UNION ALL
- INTERSECT
- EXCEPT / MINUS
- Hands-on: Combine datasets from multiple sources
- Data Modification
- INSERT INTO – adding new records
- UPDATE – modifying existing records
- DELETE – removing records
- TRUNCATE – clearing tables
- Hands-on: Update product prices and clean up data
- SQL for Data Cleaning
- Identifying duplicates
- Removing duplicates
- Handling NULL values
- Replacing missing values with default values
- String trimming and formatting
- Hands-on: Clean raw sales data for analysis
- Advanced SQL for Data Science
- Window functions:
- ROW_NUMBER(), RANK(), DENSE_RANK()
- NTILE(), LEAD(), LAG()
- Common Table Expressions (CTEs)
- Pivoting & unpivoting data
- Recursive queries
- Hands-on: Create a monthly revenue trend analysis
- Integrating SQL with Data Science Tools
- Connecting SQL to Python using sqlite3 / SQLAlchemy
- Exporting SQL query results to CSV/Excel
- Using SQL in Jupyter Notebook
- Hands-on: Run SQL queries from Python and visualize results with Matplotlib
Module 7: Machine Learning – Supervised Learning
- Introduction to Machine Learning
- What is Machine Learning?
- Definition & key concepts
- Difference between AI, ML, and Deep Learning
- Categories of Machine Learning:
- Supervised, Unsupervised, Reinforcement Learning
- Applications of Supervised Learning in real-world industries
- Overview of the Supervised Learning workflow:
- Data Collection
- Data Preprocessing
- Feature Engineering
- Model Selection
- Training the Model
- Model Evaluation
- Model Deployment
- Linear Regression
- Concept of regression & when to use it
- Simple Linear Regression:
- Equation: 𝑦 = 𝑚 𝑥 + 𝑐 y=mx+c
- Slope & intercept interpretation
- Multiple Linear Regression:
- Handling multiple features
- Assumptions in regression (linearity, independence, homoscedasticity, normality)
- Cost function – Mean Squared Error (MSE)
- Gradient Descent optimization
- Overfitting & underfitting in regression
- Hands-on:
- Build a house price prediction model using Linear Regression
- Evaluate model performance using RMSE & R² score
- Logistic Regression
- Why Logistic Regression for classification problems
- Sigmoid function & probability output
- Decision boundary concept
- Binary classification vs. multi-class classification
- Cost function for logistic regression (log loss)
- Regularization in logistic regression (L1 & L2)
- Decision Trees
- Decision tree basics
- Splitting criteria: Gini Index, Entropy, Information Gain
- Stopping criteria & pruning to avoid overfitting
- Advantages & disadvantages of decision trees
- Random Forest
- Concept of ensemble learning
- Bagging & Random Forest algorithm
- Feature importance in Random Forest
- Hyperparameter tuning (n_estimators, max_depth, max_features)
- Advantages over single decision trees
- K-Nearest Neighbors (KNN)
- Introduction to instance-based learning
- Choosing value of K & effect on bias-variance tradeoff
- Distance metrics: Euclidean, Manhattan, Minkowski
- Scaling features for KNN
- Advantages & limitations
- Model Evaluation Metrics
- Confusion Matrix – TP, FP, TN, FN
- Accuracy, Precision, Recall, F1-score
- ROC Curve & AUC score
- Precision-Recall tradeoff
- Cross-validation & train-test split
Module 8: Machine Learning – Unsupervised Learning
- Introduction to Unsupervised Learning
- Definition and key differences from Supervised Learning
- Real-world applications:
- Customer segmentation in marketing
- Anomaly detection in fraud detection
- Document/topic clustering
- Types of unsupervised learning:
- Clustering
- Dimensionality Reduction
- Association Rule Learning
- Workflow of an unsupervised learning project:
- Data collection & preprocessing
- Feature scaling
- Choosing an algorithm
- Model training
- Results interpretation
- Clustering
- K-Means Clustering
- Concept of clustering and distance-based grouping
- How K-Means works:
- Choose K initial centroids
- Assign points to nearest centroid
- Recalculate centroids
- Repeat until convergence
- Choosing optimal K (Elbow method, Silhouette score)
- Advantages & limitations
- Hands-on: Customer segmentation using K-Means
- Hierarchical Clustering
- Agglomerative vs. Divisive clustering
- Dendrograms and linkage criteria (single, complete, average)
- Advantages over K-Means
- When to use hierarchical clustering
- Hands-on: Grouping countries based on socio-economic indicators
- Dimensionality Reduction
- Principal Component Analysis (PCA)
- Why dimensionality reduction is important (curse of dimensionality)
- How PCA works:
- Covariance matrix
- Eigenvalues & eigenvectors
- Principal components
- Variance explained & choosing number of components
- Advantages and trade-offs
- Hands-on: Apply PCA to reduce dimensions in a high-dimensional dataset (e.g., MNIST)
- t-SNE (t-Distributed Stochastic Neighbor Embedding)
- Non-linear dimensionality reduction technique
- Preserving local neighborhood structure
- Key parameters: perplexity, learning rate
- Best practices for visualization
- Hands-on: Visualizing high-dimensional word embeddings
- Association Rule Learning
- Apriori Algorithm
- Market basket analysis concept
- Support, Confidence, Lift metrics
- How Apriori generates frequent itemsets
- Advantages & limitations
- Hands-on: Find frequently bought-together products in retail dataset
- Eclat Algorithm
- Difference from Apriori (depth-first search approach)
- Transaction ID sets and intersection
- Efficiency in sparse datasets
- Hands-on: Implement Eclat for transaction analysis
Module 10: Introduction to Deep Learning
- Evolution of AI → Machine Learning → Deep Learning
- Why Deep Learning? Handling unstructured data (images, text, audio)
- Key differences between Machine Learning & Deep Learning
- Real-world applications: self-driving cars, healthcare, NLP, image recognition
- Overview of popular deep learning frameworks (TensorFlow, PyTorch, Keras)
- Neural Networks Basics
- Structure of an Artificial Neural Network (ANN): neurons, layers (input, hidden, output)
- Biological inspiration: Neurons and synapses
- Forward propagation: weighted sum, bias, activation
- Backpropagation: gradient descent & optimization
- Overfitting vs underfitting in neural networks
- Hands-on: Build a simple neural network from scratch (using NumPy)
- Activation Functions
- Role of activation functions in neural networks
- Sigmoid, Tanh, ReLU, Leaky ReLU, Softmax – concepts and use cases
- Vanishing gradient & exploding gradient problems
- Choosing the right activation function for classification vs regression tasks
- Hands-on: Experiment with different activations in a simple neural net
- Introduction to TensorFlow & Keras
- Overview of TensorFlow (computational graph, tensors, operations)
- Keras as a high-level API for rapid prototyping
- Installing and setting up TensorFlow/Keras
- Key components: layers, models, optimizers, loss functions
- Hands-on: First deep learning model using Keras Sequential API
- Building a Simple Neural Network
- Steps in building a neural network:
- Data preprocessing and normalization
- Defining input, hidden, and output layers
- Choosing loss function and optimizer
- Training the model and monitoring loss/accuracy
- Evaluating model performance
- Hands-on: Build a neural network to classify MNIST digits
- Image Classification Basics (CNN Concepts)
- Why CNNs for images vs. fully connected networks
- Convolution operation: kernels, filters, strides, padding
- Pooling layers (Max pooling, Average pooling)
- Flattening and fully connected layers in CNNs
- Dropout for regularization
- Hands-on: Build a simple CNN for image classification (MNIST / CIFAR-10 dataset)
Module 11: Data Science Tools & Big Data
- 1. Jupyter Notebook & Google Colab
- Introduction to Jupyter Notebook
- Features: code cells, markdown, visualization
- Installing and setting up Jupyter Notebook
- Using magic commands (%timeit, %matplotlib inline)
- Exporting notebooks (HTML, PDF, Python scripts)
- Google Colab
- Introduction and benefits (cloud-based execution, free GPU/TPU)
- Creating and managing notebooks on Colab
- Mounting Google Drive for dataset access
- Running deep learning experiments on GPU/TPU
- Collaboration features in Colab
- Hands-on Exercises
- Git & GitHub for Version Control
- Introduction to Version Control
- Why version control is important in Data Science projects
- Git vs GitHub
- Git Basics
- Installing Git
- Core commands: git init, git add, git commit, git push, git pull
- Branching and merging
- GitHub Essentials
- Creating and managing repositories
- Cloning repositories and pushing local changes
- Pull requests, code reviews, and collaboration
- GitHub Actions (Intro to automation & CI/CD for ML projects)
- Hands-on Exercises
- Big Data Concepts & Hadoop Basics
- Introduction to Big Data
- What is Big Data? 5Vs of Big Data (Volume, Velocity, Variety, Veracity, Value)
- Challenges with traditional data processing
- Big Data in the Data Science ecosystem
- Hadoop Framework
- Hadoop ecosystem components: HDFS, YARN, MapReduce
- HDFS (Hadoop Distributed File System) – storage architecture
- MapReduce basics – processing large datasets in parallel
- Introduction to Hive and Pig (high-level querying tools)
- Use Cases
- Big Data in healthcare, finance, e-commerce, social media
- Hands-on Exercises
- Introduction to Apache Spark for Data Science
- Why Spark?
- Limitations of Hadoop MapReduce
- Advantages of Apache Spark (speed, in-memory processing, ease of use)
- Spark Basics
- Spark architecture: RDDs, DataFrames, DAG execution engine
- Spark ecosystem: Spark SQL, Spark MLlib, Spark Streaming, GraphX
- PySpark – using Spark with Python
- Data Science with Spark
- Loading and exploring datasets in Spark
- Data transformations and actions
- Integrating Spark with MLlib for machine learning
- Hands-on Exercises
Module 13: Artificial Intelligence (AI)
- Introduction to Artificial Intelligence
- What is Artificial Intelligence?
- Difference between AI, Machine Learning, and Deep Learning
- Role of AI in Data Science workflows
- Real-world AI applications (Healthcare, Finance, E-commerce, Autonomous Systems, NLP)
- AI Foundations
- Search techniques in AI (uninformed vs informed search)
- Game playing and adversarial search (Minimax algorithm, Alpha-beta pruning)
- Knowledge representation & reasoning
- Expert systems basics
- Natural Language Processing (NLP)
- Text preprocessing: tokenization, stemming, lemmatization, stop-word removal
- Bag of Words, TF-IDF, and word embeddings (Word2Vec, GloVe, FastText)
- Sentiment analysis
- Named Entity Recognition (NER)
- Introduction to Transformers (BERT, GPT)
- Hands-on: Build a text classifier
- Computer Vision
- Introduction to image processing
- Convolutional Neural Networks (CNNs) basics
- Image classification and object detection (YOLO, Faster R-CNN)
- Transfer learning for computer vision tasks
- Hands-on: Image classification with pre-trained models
- Deployment & MLOps
- Saving models (Pickle, Joblib)
- Flask / FastAPI APIs for ML
- Docker basics
- Cloud deployment (AWS/GCP/Azure)
- Reinforcement Learning
- Basics of reinforcement learning (RL)
- Key terms: Agent, Environment, Reward, Policy, Value Function
- Q-learning and Deep Q-Networks (DQN)
- Applications of RL in gaming, robotics, and recommendation systems
- Generative AI
- What is Generative AI?
- Generative Adversarial Networks (GANs) – architecture & working
- Variational Autoencoders (VAEs)
- Applications: Image synthesis, text generation, style transfer, chatbots
- Hands-on: Build a simple text or image generator
- AI with Cloud Platforms
- Introduction to AI on the Cloud (AWS AI Services, Azure Cognitive Services, Google AI/Vertex AI)
- Pre-built AI APIs: Vision, Speech, NLP, Recommendation engines
- Deploying AI models using cloud platforms
- Ethical AI & Responsible AI
- Bias in AI models
- Fairness, accountability, and transparency in AI
- Explainable AI (XAI) concepts
- Regulations & responsible use of AI
Module 12: Power BI
- Introduction to Power BI
- Get Started with Power BI
- Overview: Power BI concepts
- Sign up for Power BI
- Overview: Power BI data sources
- Connect to a SaaS solution
- Upload a local CSV file
- Connect to Excel data that can be refreshed
- Connect to a sample
- Create a Report with Visualizations
- Create a Report with Visualizations
- Hands-On
- Viz and Tiles
- Overview: Visualizations
- Using visualizations
- Create a new report
- Create and arrange visualizations
- Format a visualization
- Create chart visualizations
- Use text, map, and gauge visualizations and save a report
- Use a slicer to filter visualizations
- Sort, copy, and paste visualizations
- Download and use a custom visual from the gallery
- Hands-On
- Reports and Dashboards
- Modify and Print a Report
- Rename and delete report pages
- Add a filter to a page or report
- Set visualization interactions
- Print a report page
- Send a report to PowerPoint
- Create a Dashboard
- Create and manage dashboards
- Pin a report tile to a dashboard
- Pin a live report page to a dashboard
- Pin a tile from another dashboard
- Pin an Excel element to dashboard
- Manage pinned elements in Excel
- Manage pinned elements in Excel
- Add a tile to a dashboard
- Build a dashboard with Quick Insights
- Set a Featured (default) dashboard
- Ask Questions about Your Data
- Ask Questions about Your Data
- Tweak your dataset for Q&A
- Enable Cortana for Power BI
- Hands-On
- Publishing Workbooks and Workspace
- Share Data with Colleagues and Others
- Share Data with Colleagues and Others
- Publish a report to the web
- Manage published reports
- Share a dashboard
- Create an app workspace and add users
- Use an app workspace
- Publish an app
- Create a QR code to share a tile
- Embed a report in SharePoint Online
- Hands-On
- Other Power BI Components and Table Relationship
- Use Power BI Mobile Apps
- Get Power BI for mobile
- View reports and dashboards in the iPad app
- Use workspaces in the mobile app
- Sharing from Power BI Mobile
- Use Power BI Desktop
- Install and launch Power BI Desktop
- Get data
- Reduce data
- Transform data
- Relate tables
- Get Power BI Desktop data with the Power BI service
- Export a report from Power BI service to Desktop
- Hands-On
- DAX functions
- New Dax functions
- Date and time functions
- Time intelligence functions
- Filter functions
- Information functions
- Logical functions
- Math & trig functions
- Parent and child functions
- Text functions
- Hands-On
FAQs
eMexo Technologies technology provides Data Science with Python training by experienced trainers with over 10 years of experience.
We provide complete hands-on training.
Over 500 batches completed their training in our Institute.
And also we provide100% Job-Oriented training.
We guide students in their Certification exams and building their resume.
Unique course materials were used for training.
We help them to prepare for their job interview.
Over 2000 happy students get trained on this affordable pricing.
No problem. eMexo Technologies will reschedule the missed classes within the course period. If required you can attend those topics with any other batches.
All of our instructors are industry experts hired by top companies and have hands-on experience with Data Science with Python.
At eMexo, we believe that there is nothing better than hands-on practice when it comes to learning concepts. our teaching method is 100% practical. You learn a concept, you practice it then and there with the trainer. It also provides assignments for each topic that you can practice at home so that questions about the topic can be clarified to the trainer the next day.
Our trainers are expert professionals in their organizations and they often act as the interviewer to hire new candidates. Our trainers will help you prepare your resume with industry standards. After all, they know exactly what to look for in a resume.
Our trainers are professionals working in multinational corporations. They are experts in their field and they know exactly what the interviewer will look for in the candidate. Experienced trainers not only share interview questions but also conduct mock interviews to help prepare for the actual interview.
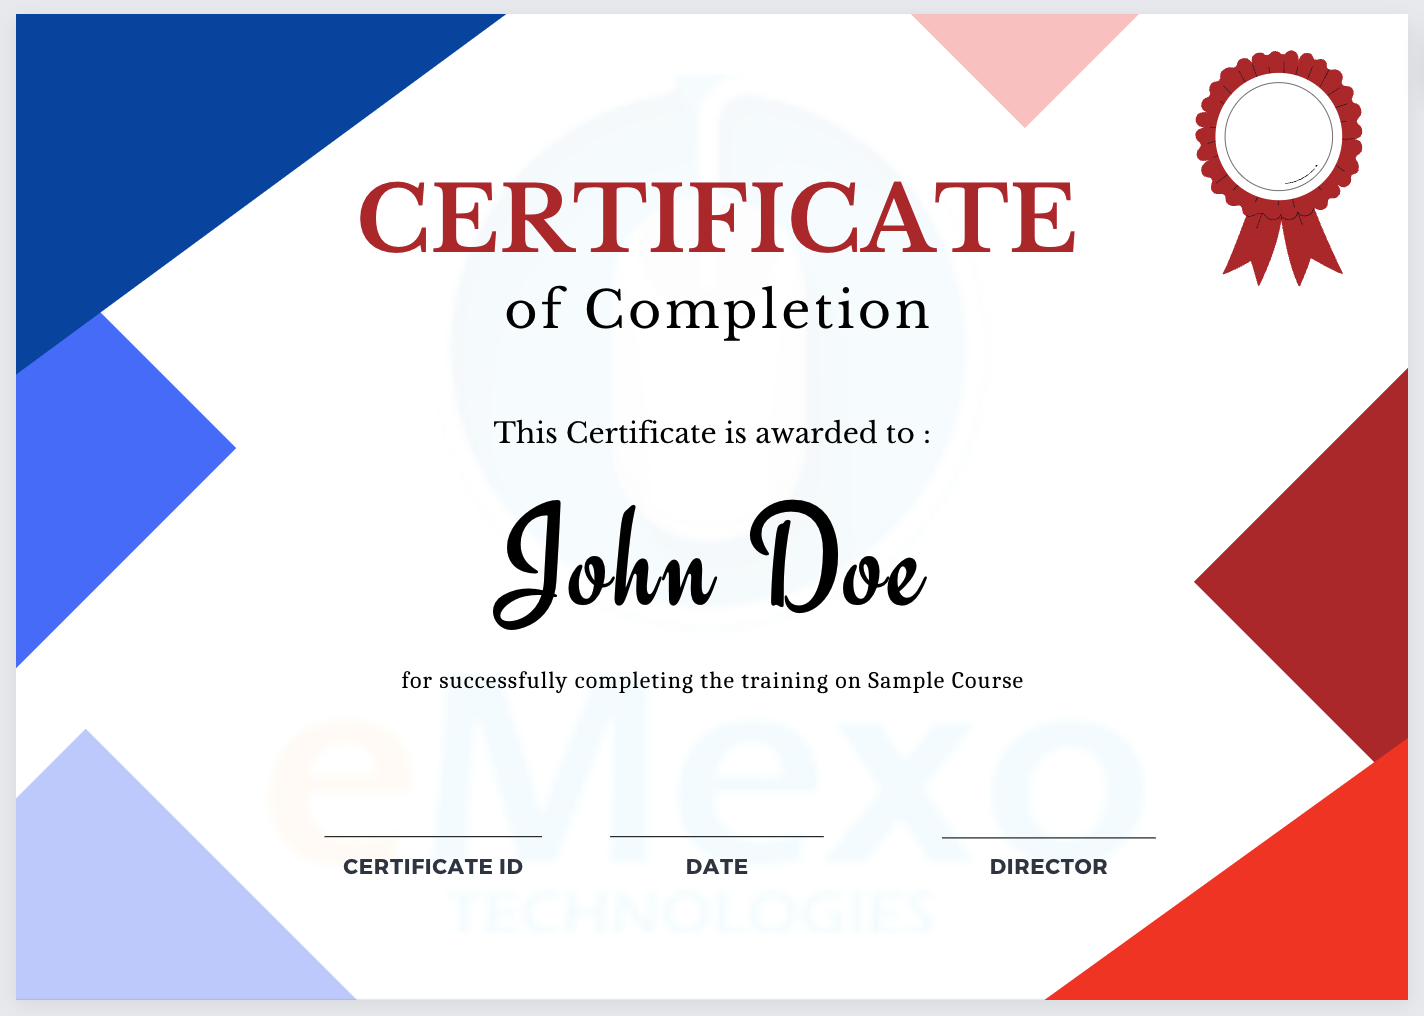
Yes, at the end of training we provide a certification of completion.
Yes, we also provide fast-track training for those who want to complete the course faster. The curriculum and the total hours required to complete the course will remain the same. However, the trainer will be spending more hours with you to complete the course.
We provide both regular and weekend training. Talk to our training partner to learn more about the timings.
Yes, apart from doing the hands-on practice our trainer will also be taking a real-world project and working with you for the implementation.
Yes, absolutely! Talk to our training counselor by phone at +91-9513216462 or email us at info@emexotechnologies.com to arrange a free demo. You can also fill in the contact us form below and we will call you to discuss your training requirements.
Yes, once enrolled in a course, you will have lifetime access to course materials.
Please contact our course advisor at +91-9513216462 or you can share your queries through info@emexotechnologies.com


